Population & Density
Where humanity lives.
Eight billion people share one planet. Explore how population is distributed across countries and cities, how densely people live, and what that means for resource demand, air quality and land use.
World population
billion
2024 · observed (UN WPP)
Global density
people/km²
computed, 2024
Urban share
%
mid-2020s · UN estimate
Countries listed
nations
largest populations, 2024
The World, Inhabited
One map. Eight billion dots.
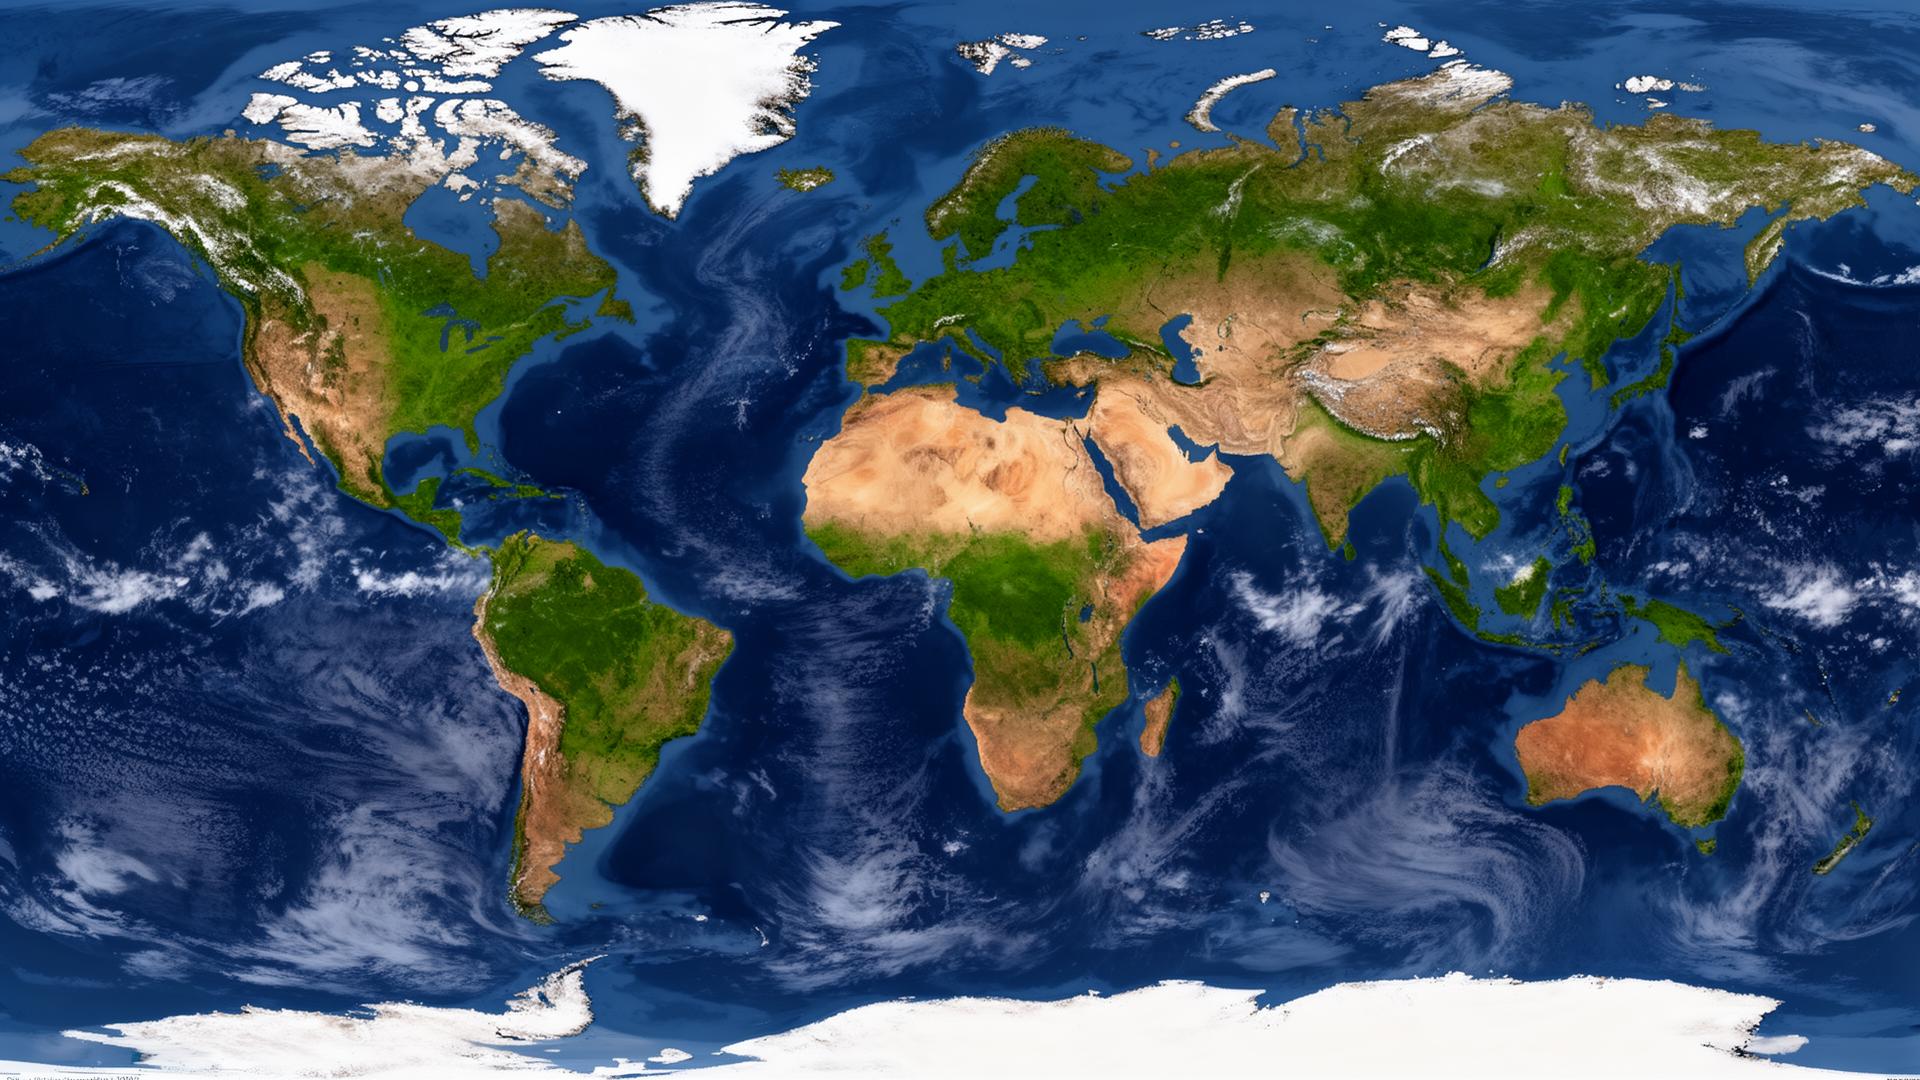
Circle size shows how many people live in each country; switch to density to see how crowded the land itself is. Tap a country to pin it.
Country Explorer
Ranked by people.
India
Asia
1.45 B
people
China
Asia
1.42 B
people
United States
North America
345.4 M
people
Indonesia
Asia
283.5 M
people
Pakistan
Asia
251.3 M
people
Nigeria
Africa
232.7 M
people
Brazil
South America
211.9 M
people
Bangladesh
Asia
173.5 M
people
Russia
Europe
144.8 M
people
Ethiopia
Africa
132.1 M
people
Mexico
North America
130.9 M
people
Japan
Asia
123.8 M
people
Philippines
Asia
115.8 M
people
Egypt
Africa
114.5 M
people
DR Congo
Africa
109.3 M
people
Vietnam
Asia
100.9 M
people
Iran
Asia
91.6 M
people
Turkey
Asia
87.5 M
people
Germany
Europe
84.6 M
people
Thailand
Asia
71.7 M
people
United Kingdom
Europe
69.1 M
people
France
Europe
66.6 M
people
South Africa
Africa
64.0 M
people
Italy
Europe
59.3 M
people
Kenya
Africa
56.4 M
people
Colombia
South America
52.9 M
people
South Korea
Asia
51.7 M
people
Spain
Europe
47.9 M
people
Argentina
South America
45.9 M
people
Canada
North America
39.7 M
people
Poland
Europe
38.5 M
people
Morocco
Africa
38.1 M
people
Saudi Arabia
Asia
36.9 M
people
Australia
Oceania
27.4 M
people
Norway
Europe
5.5 M
people
Population: UN World Population Prospects 2024 (2024). Density computed from World Bank land area. Data refreshed October 2026.
A Century of Growth
From 2.5 to 9.7 billion.
World population has roughly quadrupled since 1950. Everything after 2024 is the UN's medium-variant projection — a scenario, not a certainty.
Source: UN World Population Prospects 2024 revision. Projections assume medium fertility; outcomes depend on policy, education and health trends.
City Explorer
The century of cities.
More than half of humanity lives in urban areas. Compare the world's largest agglomerations — and note how much boundaries matter.
City proper
The legal/administrative boundary of the city government. Can be tiny (Paris) or vast (Chongqing).
Urban area
The continuously built-up footprint — what the city physically covers, regardless of borders.
Metropolitan area
The wider economic region of commutes and suburbs. Usually the largest count of the three.
Which definition is shown? The figures below are urban agglomeration estimates (UN World Urbanization Prospects 2018) — the built-up urban area. City-proper and metro counts for the same city can differ by millions of people, so rankings change with the boundary chosen. City densities are rounded estimates (Demographia World Urban Areas 2024).
Most populous urban areas
- 1Tokyo· Japan37.4 M
- 2Delhi· India30.3 M
- 3Shanghai· China27.1 M
- 4São Paulo· Brazil22.0 M
- 5Mexico City· Mexico21.9 M
- 6Dhaka· Bangladesh21.0 M
- 7Cairo· Egypt20.9 M
- 8Beijing· China20.5 M
- 9Mumbai· India20.4 M
- 10Osaka· Japan19.2 M
Most densely populated (built-up)
- 1Mumbai· India31,000 /km²
- 2Dhaka· Bangladesh30,000 /km²
- 3Karachi· Pakistan24,000 /km²
- 4Kolkata· India22,000 /km²
- 5Lagos· Nigeria17,000 /km²
- 6Manila· Philippines16,000 /km²
- 7Jakarta· Indonesia14,000 /km²
- 8Kinshasa· DR Congo13,000 /km²
- 9Delhi· India12,000 /km²
- 10Cairo· Egypt10,000 /km²
Compare two cities
Tokyo
Japan
37.4 M people
≈ 4,500 people/km² (est.)
Dhaka
Bangladesh
21.0 M people
≈ 30,000 people/km² (est.)
Two Different Questions
Population vs density.
Population asks how many
The total number of people in an area. India's 1.45 billion people matter for global food, energy and emissions totals — no matter how the land is used.
Density asks how close
People per square kilometre. Dense cities can be efficient (shared transit, less land per person) or strained (congested air, pressure on water and waste systems) — density alone doesn't decide which.
Population & Environment
Where people live, pressure follows.
Population patterns shape — and are shaped by — air pollution, land use, water stress and waste. But more people doesn't automatically mean more pollution: income, energy mix and policy matter more.
Tracked countries · density vs air quality
5 most dense
avg AQI 96
avg CO₂/person 5.5 t
5 least dense
avg AQI 37
avg CO₂/person 10.3 t
Correlation, not causation. These averages come from PRITHVI's tracked environmental countries (IQAir 2023 · Global Carbon Project). Denser countries in this sample tend to have higher measured PM2.5, while sparser, higher-income countries emit more per person — population is only one factor among many.
What population patterns connect to
- Air pollution concentrates where people, traffic and industry overlap — see city dashboards for local detail.
- Land use shifts as urban areas expand and farmland feeds more people — visible in the Timelapse's forest layer.
- Waste & water demand rises with population and income; management capacity, not headcount alone, decides impact.
Sources & data availability
- • Country population & world timeline: UN World Population Prospects 2024 revision · reference year 2024 · 2025–2050 are medium-variant projections.
- • City population: UN World Urbanization Prospects 2018 (urban agglomerations) · boundary-dependent, see definitions above.
- • City density: Demographia World Urban Areas 2024 · rounded built-up density estimates.
- • Land area: World Bank / FAO · densities are computed, not estimated.
No live population counters are shown — this is a verified snapshot, refreshed October 2026. Where no reliable figure exists, it is marked as an estimate or projection rather than invented.