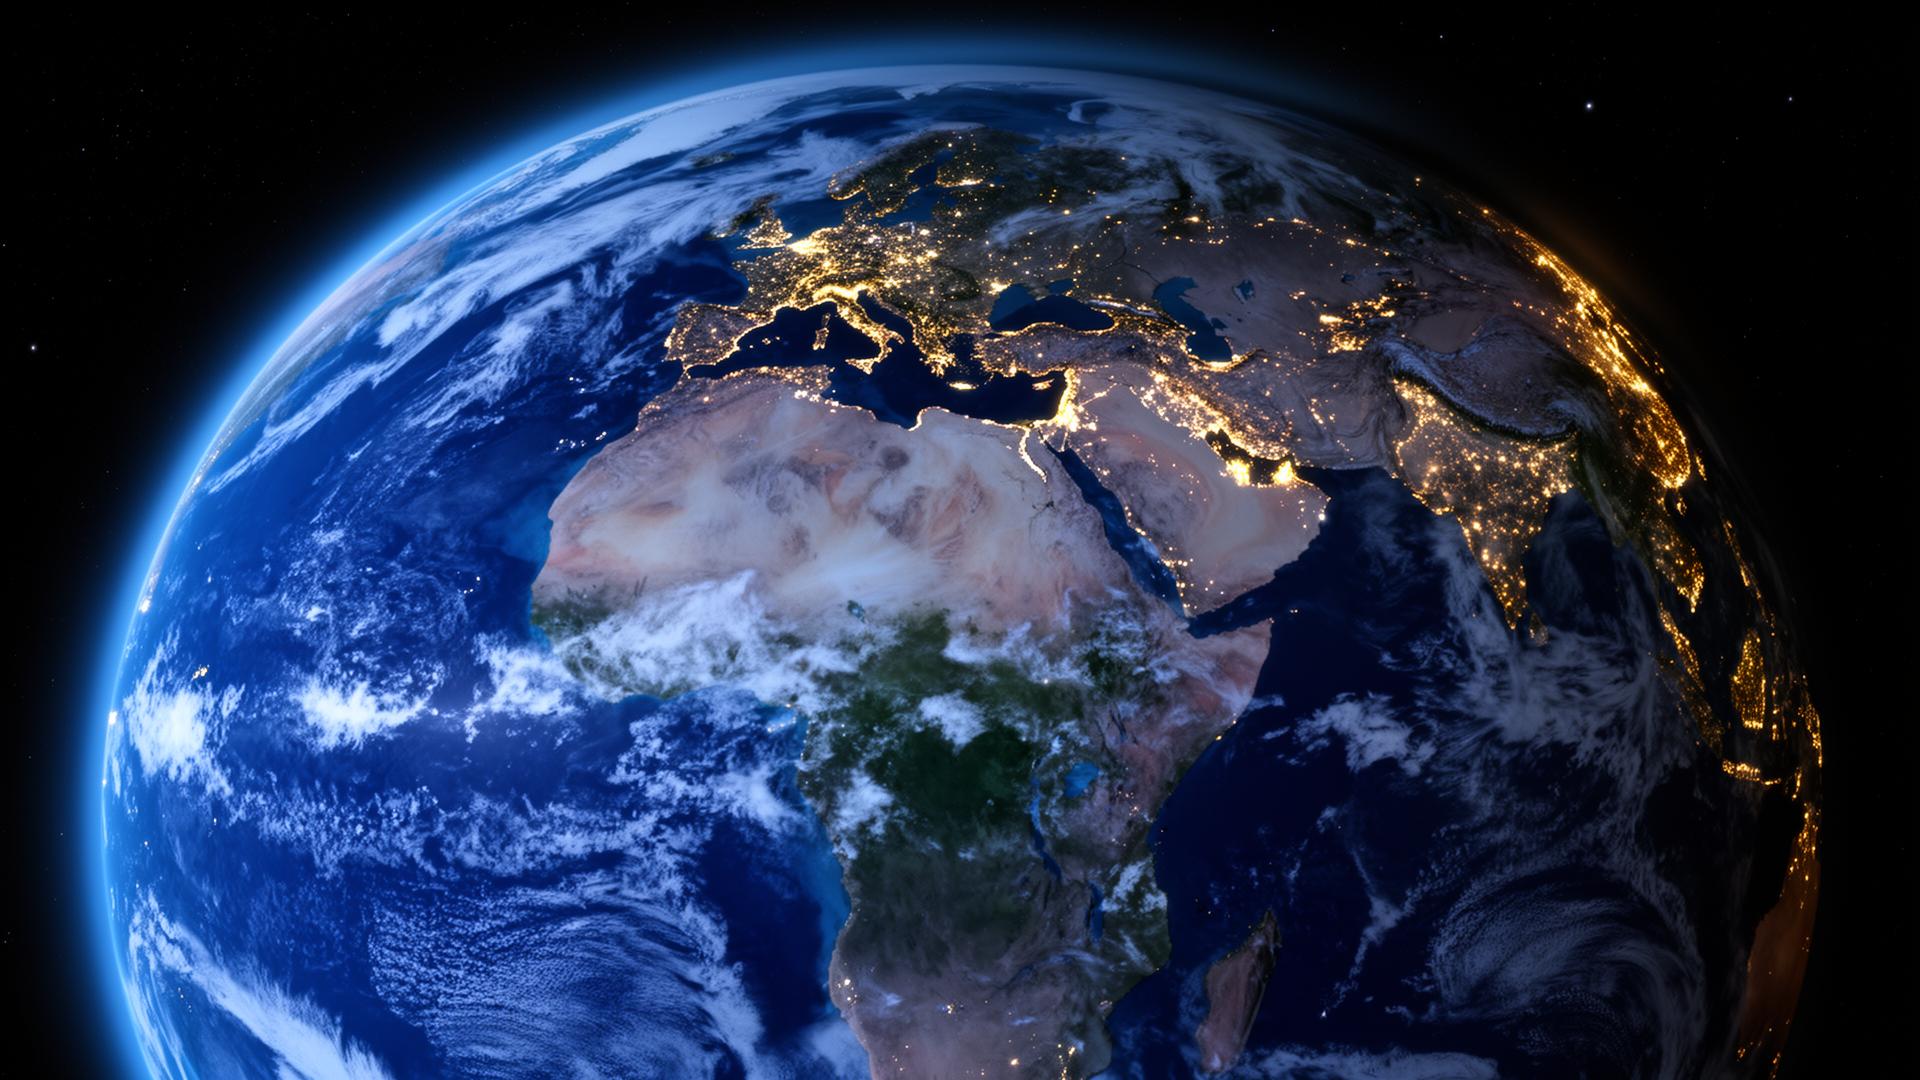
Satellite view of Earth from space
Live · Earth Observation

PRITHVIEnvironmental Intelligence Platform

The planet's vitals, in real time. Carbon, climate, forests and oceans — from 1970 to today.

Two ways to make it personal

The planet. Your place in it.

Discover how our world is changing — and what your everyday choices mean for it.

Carbon through timeHistorical / interpolated
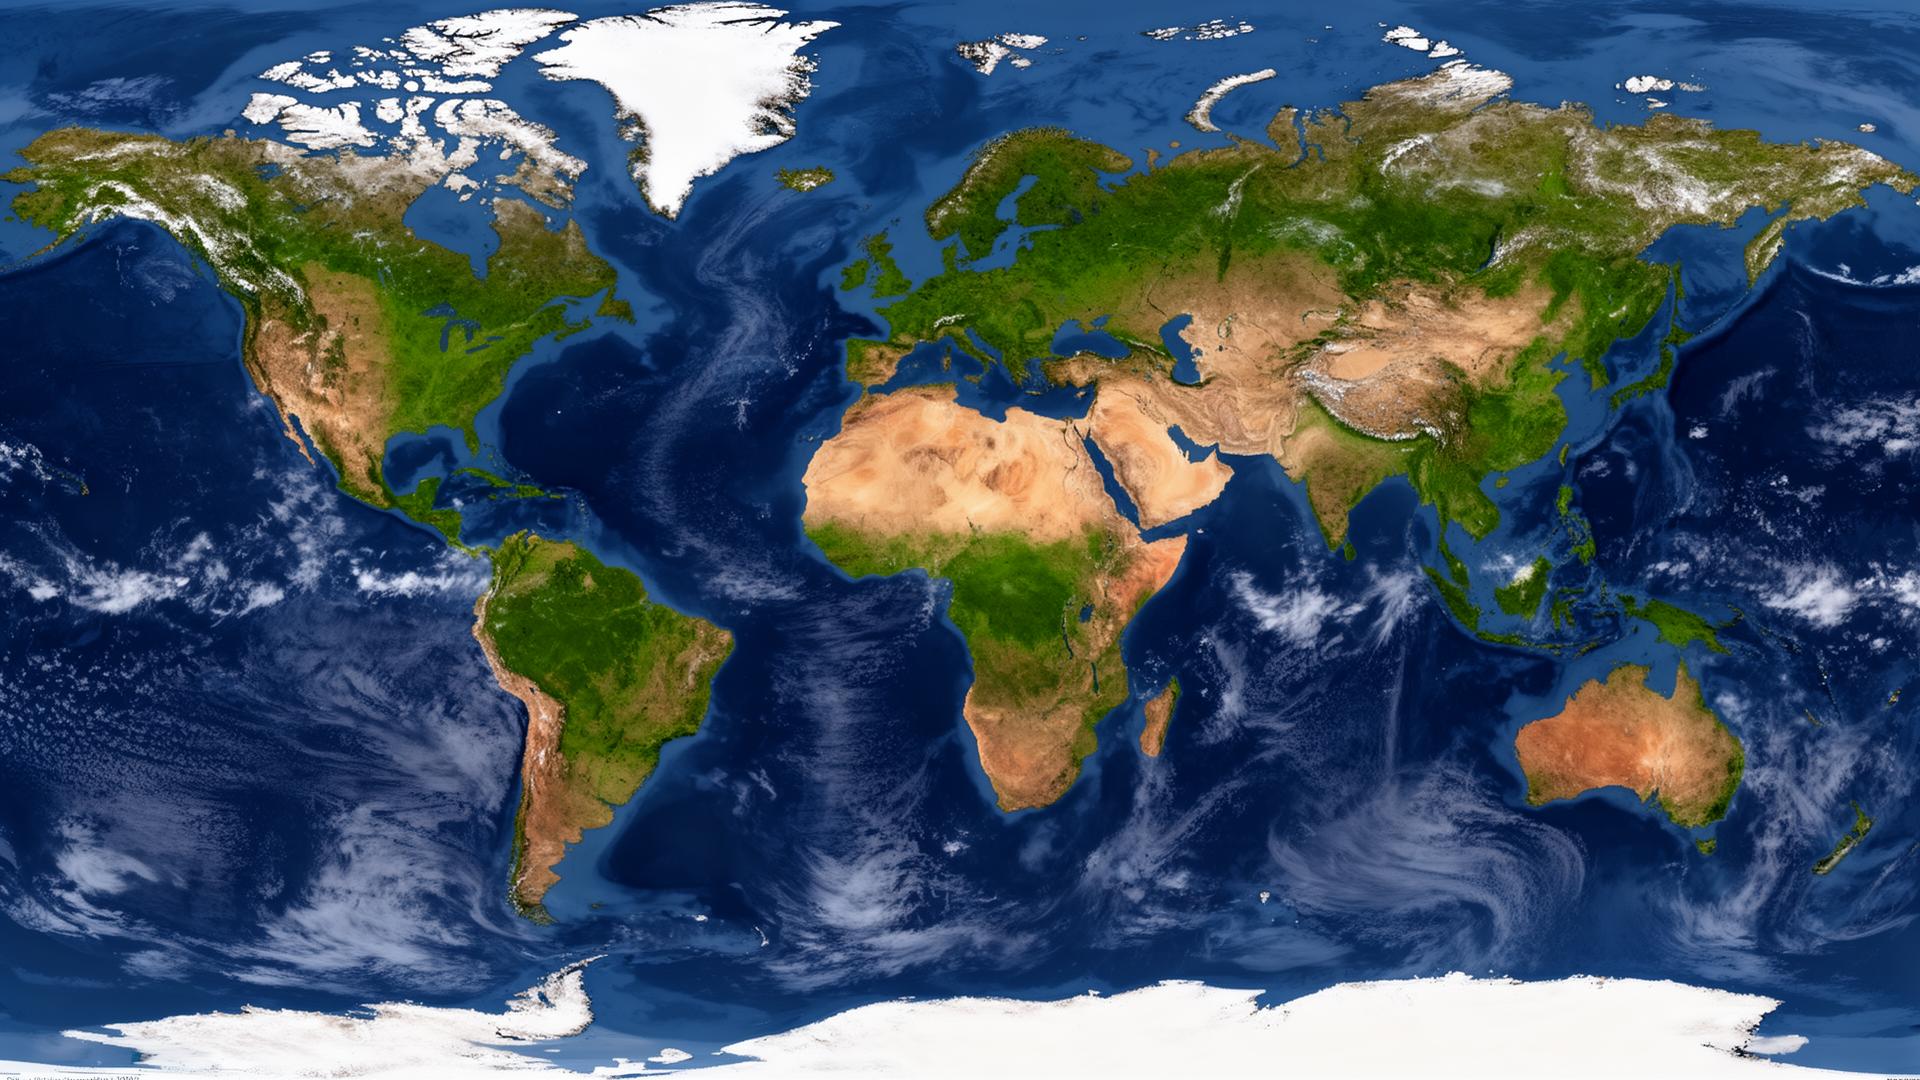
China · 2023: 11.9 Gt CO₂United States · 2023: 5.06 Gt CO₂India · 2023: 2.95 Gt CO₂Russia · 2023: 1.79 Gt CO₂Japan · 2023: 1.07 Gt CO₂Germany · 2023: 0.67 Gt CO₂Brazil · 2023: 0.48 Gt CO₂France · 2023: 0.3 Gt CO₂United Kingdom · 2023: 0.34 Gt CO₂South Africa · 2023: 0.42 Gt CO₂Australia · 2023: 0.39 Gt CO₂Canada · 2023: 0.58 Gt CO₂Mexico · 2023: 0.43 Gt CO₂Indonesia · 2023: 0.69 Gt CO₂Nigeria · 2023: 0.12 Gt CO₂Norway · 2023: 0.04 Gt CO₂
2023
19702026

Global Carbon Project anchors · 2024–2026 projected · color intensity: lower → higher emissions

Timelapse Explorer

Follow 1970–2026 across six environmental layers. Explore carbon, air quality, forests, plastic, urban expansion and ozone, with year-by-year insights.

Explore Timelapse

Aerial view of a forest canopy

4.7

t CO₂ / person / year

Global average · your comparison starts here

Travel
Energy
Diet
Waste

Personal Carbon Footprint

Turn travel, electricity, diet and everyday habits into an annual estimate. Compare your results and discover personalized ways to reduce your impact.

Calculate Your Footprint

Planetary Vitals

Earth, at a glance.

Industrial emissions

CO₂

Gt

+1.4% YoY

City air pollution

Air Quality

AQI

+4 YoY

Plastic in the ocean

Plastic

Mt

+2.1% YoY

Forest canopy

Forest

%

−11.1 Mha YoY

Tracked-country indicators, not global totals. Baselines vary: emissions and air quality 2023, forest cover 2020; plastic values are estimates. Historical series interpolate between source anchors.

The World, Live

Every nation. Every breath.

Tap any country to see its environmental footprint. The map updates in real time as new satellite data arrives.

China — 11.9 Gt CO₂ · AQI 95United States — 5.06 Gt CO₂ · AQI 38India — 2.95 Gt CO₂ · AQI 152Russia — 1.79 Gt CO₂ · AQI 49Japan — 1.07 Gt CO₂ · AQI 35Germany — 0.67 Gt CO₂ · AQI 41Brazil — 0.48 Gt CO₂ · AQI 45France — 0.3 Gt CO₂ · AQI 41United Kingdom — 0.34 Gt CO₂ · AQI 38South Africa — 0.42 Gt CO₂ · AQI 73Australia — 0.39 Gt CO₂ · AQI 36Canada — 0.58 Gt CO₂ · AQI 35Mexico — 0.43 Gt CO₂ · AQI 67Indonesia — 0.69 Gt CO₂ · AQI 105Nigeria — 0.12 Gt CO₂ · AQI 156Norway — 0.038 Gt CO₂ · AQI 21
Good Moderate Unhealthy Hazardous

Top Emitters

Where the carbon comes from.

Atmospheric CO₂

The line we can't unbend.

Parts per million in Earth's atmosphere, from 1970–2026. NOAA source anchors are interpolated between observations; later values are projected.

Travel through time.

Watch fifty years of climate change unfold across the planet in a single cinematic sweep.